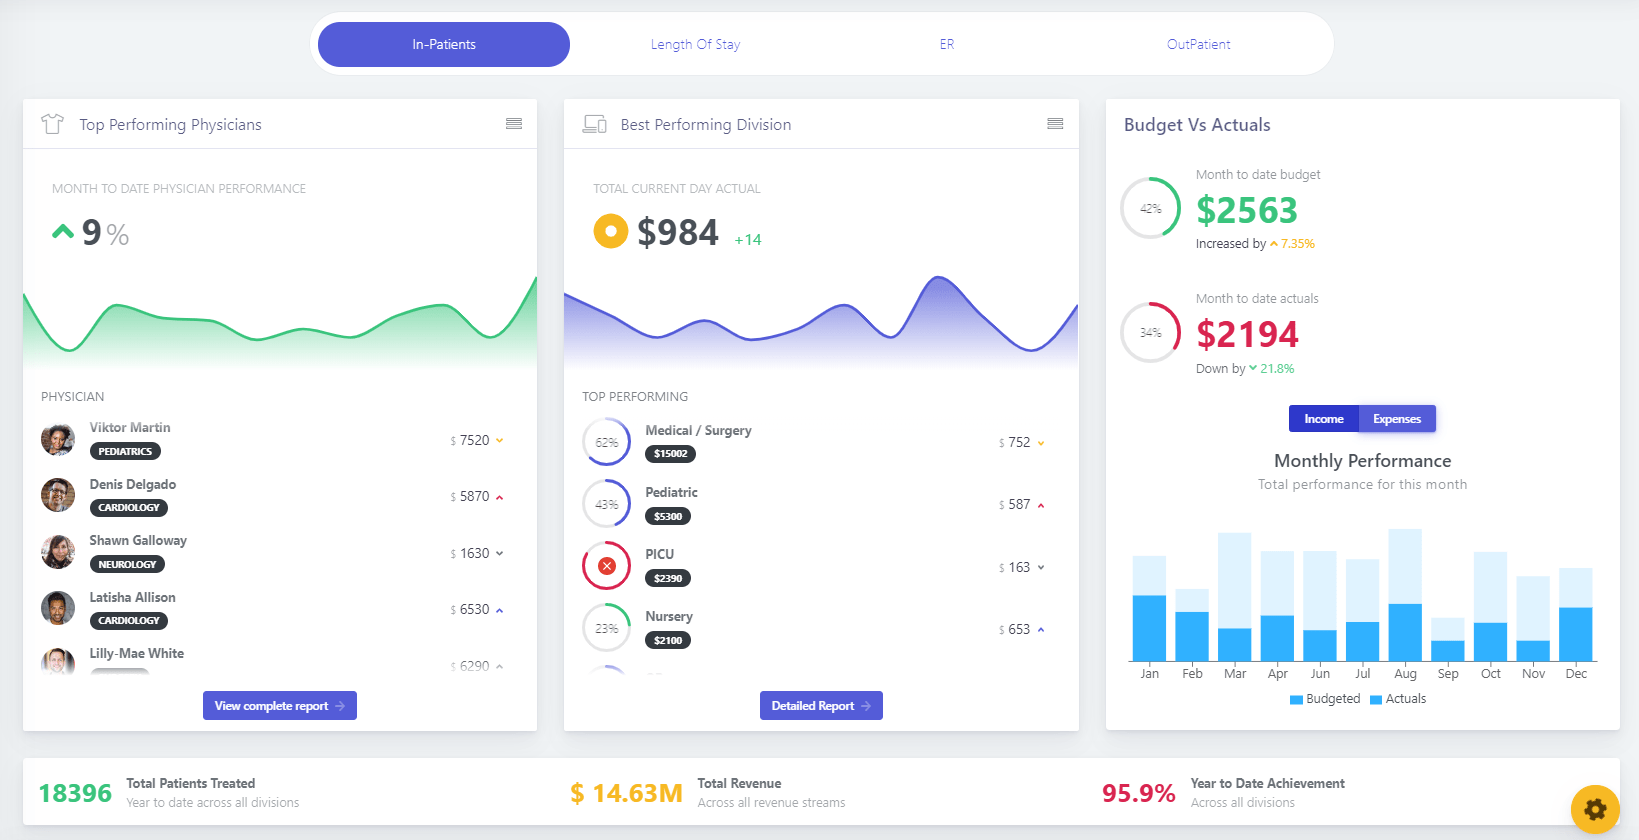
We have revolutionized the way CXO’s interact with data, through smart, real-time, and low latency dashboards
Our Comprehensive, AI driven intuitive data visualization and Analytics platform helps to process information into insights and make better decisions, with highest patient care
Our TruVu Data visualization platform is designed for CXO’s/Senior Management of hospitals, to get insights about acute care, emergency care, extended care, community health in addition to specific diagnosis cases like COVID-19 and operational, financial, supply chain measures. Our Platform is capable of using data from various sources/formats across healthcare provider organizations functions and draw correlations to drive strategic decisions, powered by our ActiveInsights.
The Information Overload Problem
“Are you suffering from information overload? Thinking about how to visualize your complex data in a simpler and more attractive way? The good news is that we have an easy solution for processing and converting information/data into something fascinating and active insights dashboards without any system integration and complexity.” Healthcare provider business generates huge data every day at enterprise level for consumers, patients, clinical data, care, operational and supply chains, which is often manually reconciled for executive reporting.
There are lot of insights into the organizational performance hidden in this data which hold the key to unlock operational potential of healthcare provider. The right presentation of data to provide the leadership team a single pane of glass to see all reconciled data in one place, understand the co-relation between data points from various divisions to effectively plan and track progress is more crucial than ever for faster, effective and data driven decision making.
The TruVu Solution
GSS’s TruVu is a one of its kind data visualization and simplification platform to consolidate data and cut through complexity. Leveraging the latest in technology, the platform empowers leaders at all levels to visualize, monitor, share, and report Key Performance Indicators without having to enter data in a new application or providing access to their applications.
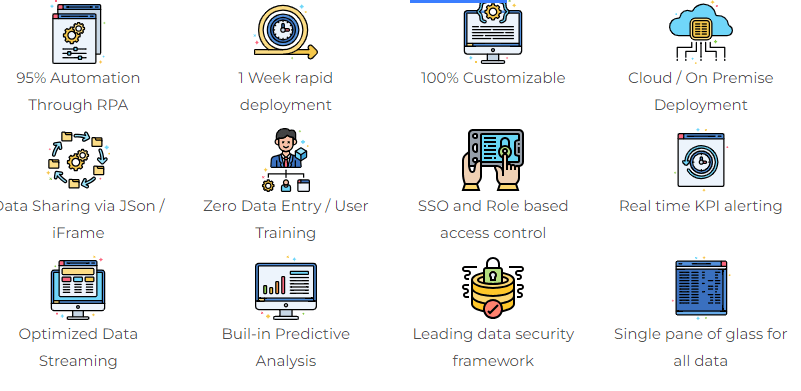
TruVu is platform that runs on 95% automation leveraging RPA and leading Machine Learning techniques to analyse, summarize, predict and present complex data as simple Pivots, Table, Bar, Line, Area, Gauges, Pie, etc. for point-in-time and historic data. The platform is built for rapid deployment thus allowing users to start tracking KPIs and get alerted on thresholds immediately for proactive action and laser focused decisions.

“Our Data Visualization platform is easy to navigate and organize the information in a simple and understandable insights”
Key Insights

